International Merchandise Trade Statistics - January 2024
1. National Sustainable Development Plan Indicators (NSDP)
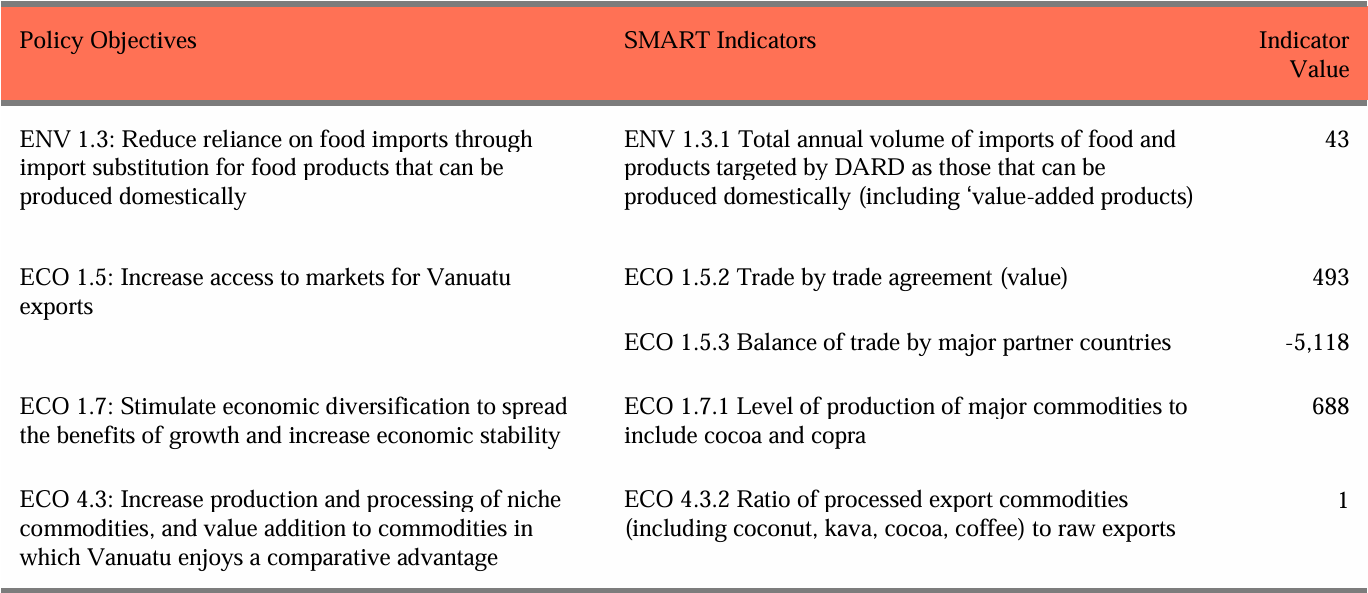
Total value of imports targeted by Department of Agriculture and Rural Development (DARD) as those that can be produced domestically is VT 43 million (ENV 1.3.1). The products imported included Potatoes (VT 14 million), Onions and Shallots (VT 15 million), Cauliflower and Broccoli (VT 1 million), Carrots and Turnips (VT 3 million), Oranges (VT 8 million), Capsicum (VT 1 million) and Tomatoes (VT 1 million). (Refer to Table 16).
The total value of the Melanesian Spearhead Group (MSG) agreement is VT 493 million (ECO 1.5.2). This Trade-by-Trade agreement included total exports of VT 42 million and total imports of VT 452 million. (Refer to Table 11). The Balance of Trade by Major Partner Countries is VT -5,118 million (ECO 1.5.3). (Refer to Table 8).
Level of production of major commodities is VT 688 million (ECO 1.7.1). The major commodities included Cocoa (VT 108 million), Coconut Oil (VT 12 million), Coffee (VT 1 million), Copra (VT 12 million), Kava (VT 532 million) and Wood (VT 25 million). The ratio of processed export commodities including coconut, kava, cocoa, and coffee to raw exports is 1 (ECO 4.3.2). Total value of processed exports is VT 382 million and total value of raw exports is VT 299 million.
2. Trade Balance by Major Partner Countries

Balance of trade by major partner countries is VT -5,118 million. The main countries that account for this Balance are Singapore (VT -1,815 million), China (VT -867 million), New Zealand (VT -581 million), Australia (VT -521 million), and Fiji (VT -484 million). These countries represent 83 per cent of the total Balance by Major Partner Countries (VT -4,268 million). (Refer to Table 8).
Major imports from Singapore were Mineral products (VT 1,710 million); and Prepared Foodstuffs, Beverages, Alcohol, and Tobacco (VT 33 million). Major imports from China were Machinery & Electrical Appliances (VT 322 million), and Base Metals and articles thereof (VT 186 million). Major imports from New Zealand were live animal and animal products (VT 113 million), and Machinery and Electrical Appliances (VT 66 million). Major imports from Australia were live animal and animal products (VT 132 million), and Machinery and Electrical Appliances (VT 105 million). Major imports from Fiji were Prepared Foodstuffs, Beverages, Alcohol, and Tobacco (VT 288 million), and live animal Products (VT 55 million).
3. Trade Balance of Pacific Islands (excluding Melanesian Islands, Australia and New Zealand)

Total Trade Balance of Pacific Islands excluding Melanesia, Australia and New Zealand is VT 222 million. This was driven by exports of Kava (VT 225 million) to Kiribati, Pharmaceuticals less than a million to Nauru, and imports of Medicaments, Vaccines and Paintings from the French Polynesia (VT 3 million).
4. Trade by Trade Agreement- Melanesian Spearhead Group

The major imports from Fiji are canned meats (VT 100 million), and Bakery products (VT 79 million. The major imports from Papua New Guinea are canned meats (VT 11 million) and from the Solomon Islands is Prepared or Preserved Fish (VT 10 million). (Refer to Table 11) The major export to Fiji is Kava (VT 38 million) and to Solomon Islands is Personal effects (VT 2 million).
5. Principle Exports
The level of production of the top five Major Principal Exports is VT 663 million. The Principal Exports identified included: Cocoa (VT 108 million), Coconut Oil (VT 12 million), Copra (VT 12 million), and Kava (VT 532 million). (Refer to Table 6)
The major country of destination for Cocoa is Malaysia (VT 73 million), for Coconut Oil is Taiwan (VT 9 million), and Copra is Bangladesh (VT 12 million). Kava is exported mainly to Kiribati (VT 224 million), United States of America (VT 117 million) and China (VT 103 million).
6. Top 5 New Major Exports
Total value of Scrap Metal VT 8 million, Personal effects VT 4 million, Aircraft parts VT 4 million, Dried Kava chips VT 1 million, and Pharmaceuticals VT 1 million.
7. Principle Imports
Total value of top five Principal imports is VT 2,176 million. The Principal Imports included Alcoholic Drinks (VT 68 million), Articles of Iron and Steel (VT 140 million), Medicaments (VT 46 million), Petroleum Oils (VT 1,798 million), and Rice (VT 124 million). The main country of origin for Alcoholic Drinks is Australia (VT 29 million).
The main country of origin for Articles of Iron and Steel is China (VT 75 million), and Medicaments is New Zealand (VT 15 million). The main country of origin for Petroleum Oils is Singapore (VT 1,792 million), and Rice is Taiwan (VT 68 million). (Refer to Table 7)
8. Top 5 New Major Imports
Total value of Reinforcing Steel VT 30 million, Chainsaws VT 26 million, Mobile Home Box VT 19 million, Timber VT 17 million, and Air Condition VT 17 million.
9. Imports of Dietary Risk Factors for Noncommunicable Diseases
Total value of Bakery Products is VT 108 million and are mainly imported from Fiji (VT 79 million). Total value of Canned Meats is VT 119 million and are mainly imported from Fiji (VT 100 million). Total value of Confectionary is VT 10 million and are mainly imported from Australia (VT 3 million). Total value of Cordial is VT 32 million and are mainly imported from France (VT 10 million). Total value of Noodles is VT 2 million and are mainly imported from New Zealand (VT 1 million). (Refer to Table 15)
10. Imports of food and products targeted as those that can be produced domestically
Total value of Chicken is VT 207 million and are mainly imported from Australia (VT 115 million). Total value of Canned Tunas is VT 22 million and are mainly imported from Solomon Islands (VT 10 million). Total value of Canned Mackerel is VT 29 million and are mainly imported from China (VT 15 million). Total value of Chicken Eggs VT 28 million and are mainly imported from Fiji (VT 23 million). (Refer to Table 17)
Table Downloads
The format content in these monthly provisional highlights is as below:
- National Sustainability Development Plan (NSDP Indicators: The NSDP serves as the Country’s highest level policy framework. The indicators provide a system to monitor progress. To report on trade related NSDP indicators, some adaptions has been made. This include ENV E.3.1 report value, not volume ECO 1.5.2 and ECO 1/6/2 reporting on Melanesian Spearhead Group (MSG) agreement, ECO 1.7.1 reporting on level of export production of major commodities.
- Trade Balance of Major Partner Countries: Balance of Trade is the value of a country’s exports and the value of a country’s imports for a given period. The Major Partner Countries are: Australia, China, Fiji, France, Hongkong, India, Indonesia, Japan, South Korea, Malaysia, Netherlands, New Caledonia, New Zealand, Papua New Guinea, Philippines, Singapore, Solomon Islands, Thailand, United Kingdom and United States of America.
- Trade Balance of Pacific Islands, excluding Melanesian Islands, Australia and New Zealand: The Pacific Islands included are: American Samoa, Tonga, Cook Islands, Kiribati, Federated States of Micronesia, Micronesia, Marshall Islands, Nauru, Niue, Palau, Samoa, French Polynesia, Tuvalu and Wallis and Futuna.
- Trade by Trade Agreement - Melanesian Spearhead Group: The Melanesian Free Trade Agreement (MFTA) aims to achieve regional integration of economics in the MSG. It comprises four (4) Countries namely, Fiji, Papua New Guinea, Solomon Islands and Vanuatu.
- Major Principal Exports: Major Exports are commodities that account for the majority of the total export value. The commodity group focus is Beef, Cocoa, Coconut Oil, Copra and Kava. Focus is a time series analysis of current monthly exports from 2018 to 2023.
- Top 5 New Major Exports: The traditional VNSO tables report on 13 major commodities. The rest of the commodities are grouped as “other products”. This investigates the main commodities within “other products”.
- Major Principal Imports: Major imports are commodities that account for the majority of the total import value. The commodity group focus is Alcoholic drinks, Articles of Iron and Steel, Medicaments, Petroleum oils and /Rice. Focus is a timeseries analysis of current monthly imports from 2018-2023.
- Top 5 New Major Imports: The Traditional VNSO tables report on 47 major import commodities. The rest of the commodities are grouped as “other Imports”. This investigates the main commodities within “other imports”.
- Imports of Dietary Risk Factors for Non-Communicable Diseases (NCD): The Pacific has a growing reputation as having one of the world’s highest NCD rates. These major NCD, is share for behavioural risk factors; tobacco use, unhealthy diet, physical inactivity and harmful use of alcohol. This investigates some of the dietary risk factors including Bakery Products, Canned Meats, Confectionary, Cordial and Noodles.
- Imports of Food and Products Targeted as those that can be Potentially Produced Domestically: Import substitution is the idea that; blocking imports of manufactured goods can help an economy by increasing the demand for domestically produced goods. The imports of foods and products targeted include: Canned Mackerel, Canned Tunas, Chicken and Chicken eggs.