International Merchandise Trade Statistics - December 2023
1. National Sustainable Development Plan Indicators (NSDP)
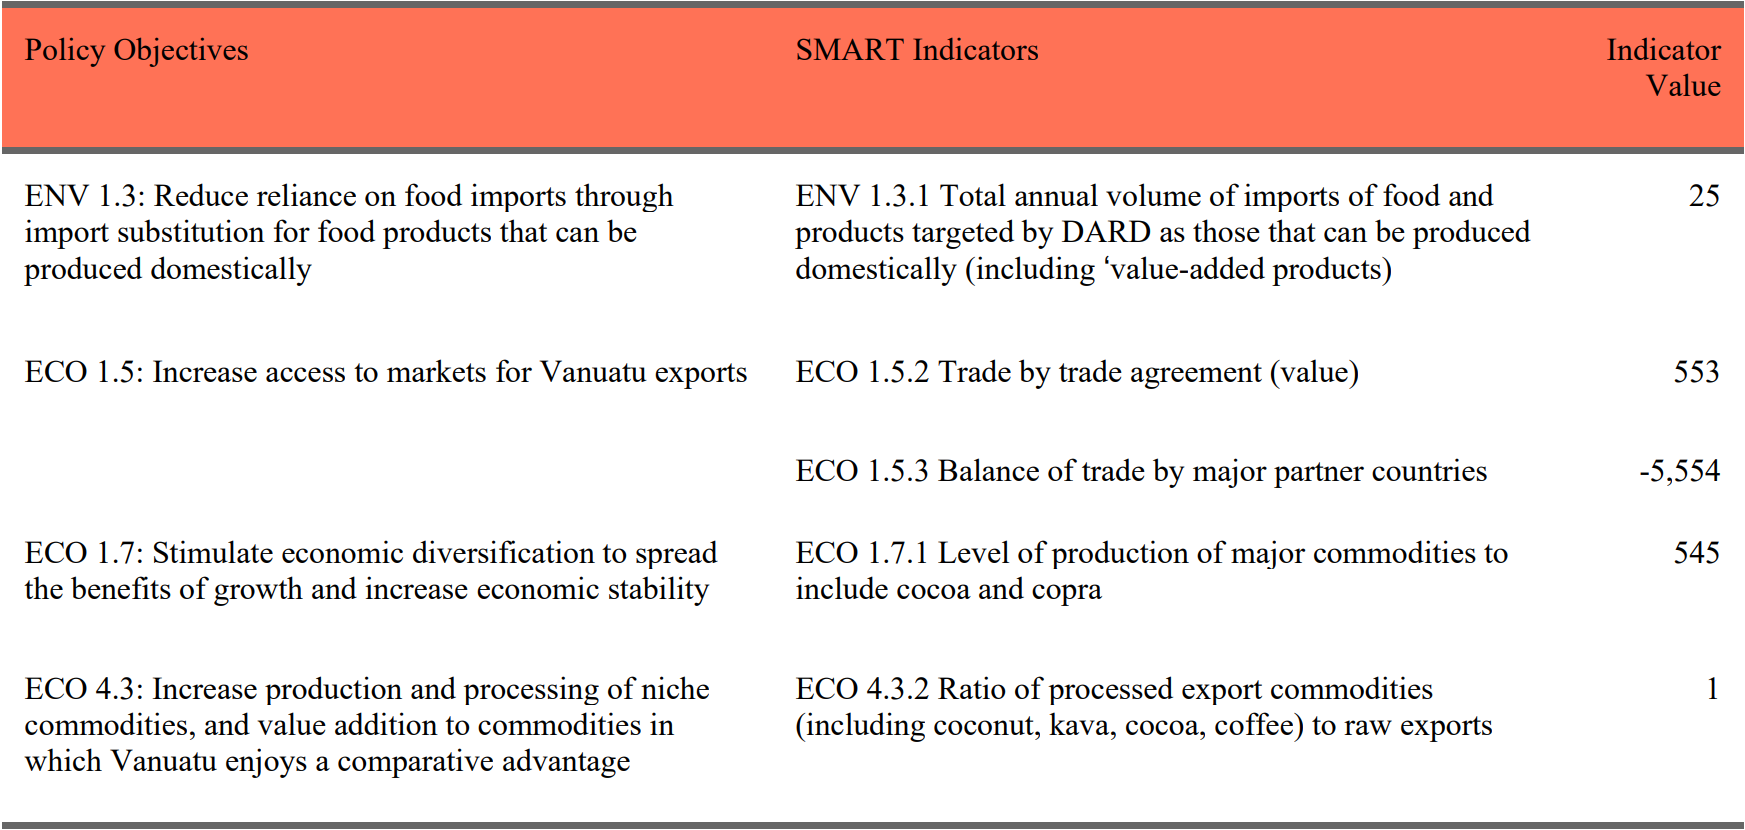
Total value of imports targeted by Department of Agriculture and Rural Development (DARD) as those that can be produced domestically is VT 25 million (ENV 1.3.1). The products imported included Potatoes (VT 11 million), Onions and Shallots (VT 7 million), Carrots and Turnips (VT 2 million), Oranges (VT 2 million), Cauliflower and Broccoli (VT 1 million) and Tomatoes (VT 1 million). (Refer to Table 16).
The total value of the Melanesian Spearhead Group (MSG) agreement is VT 553 million (ECO 1.5.2). This Trade-by-Trade agreement included total exports of VT 61 million and total imports of VT 492 million. (Refer to Table 11). The Balance of Trade by Major Partner Countries is VT -5,554 million (ECO 1.5.3). (Refer to Table 8).
Level of production of major commodities is VT 545 million (ECO 1.7.1). The major commodities included Kava VT 326 million, Copra VT 106 million, Cocoa VT 98 million, Coconut Oil VT 9 million, Wood VT 5 million and Coffee VT 2 million. The ratio of processed export commodities including coconut, kava, cocoa, and coffee to raw exports is 1.0 (ECO 4.3.2). Total value of processed exports is VT 275 million and total value of raw exports is VT 263 million. (Refer to Table 6).
2. Trade Balance by Major Partner Countries
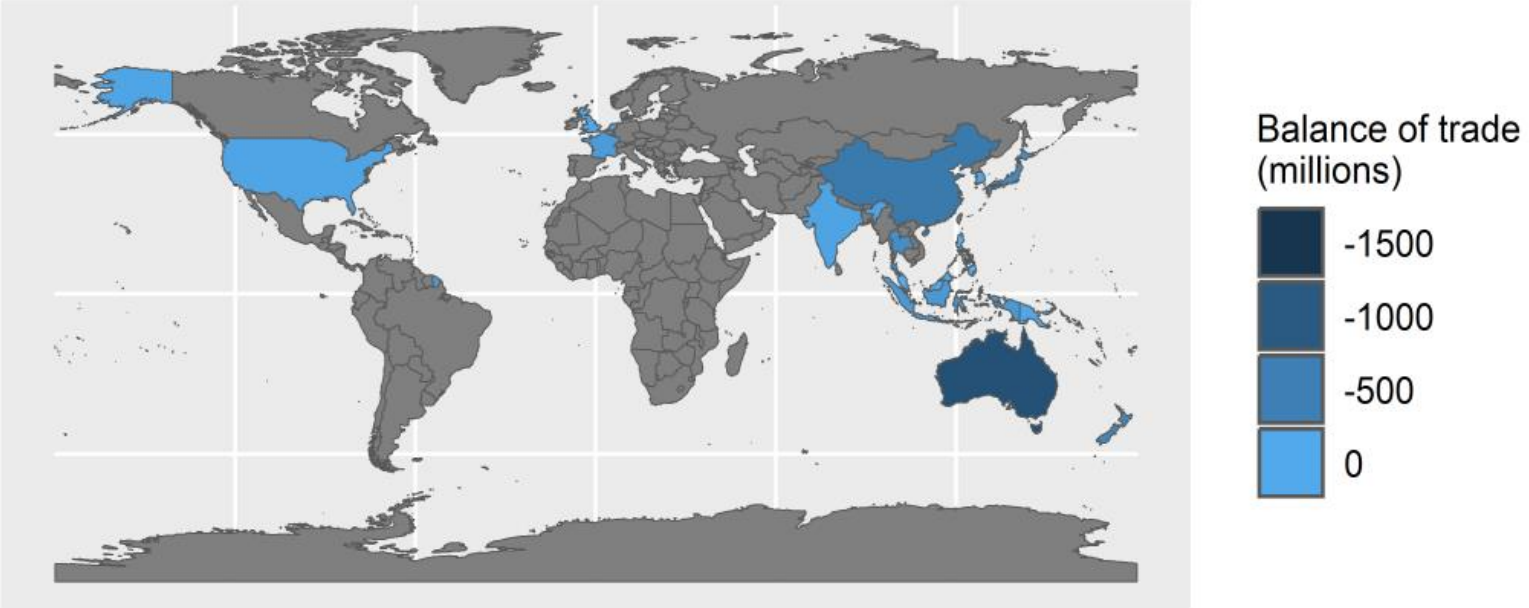
Balance of trade by major partner countries is (VT -5,554 million). The main countries that account for this Balance is Singapore (VT -1,645 million), Australia (VT -1,104 million), China (VT -580 million), Fiji (VT -570 million) and New Zealand (VT -409 million). These countries represent 78% of the total Balance by Major Partner Countries (VT -4,309 million). (Refer to Table 8).
Major imports from Singapore were Mineral products (VT 1,594 million) and Machinery & Electrical Appliances (VT 12 million). Major imports from Australia were Prepared Foodstuffs, Beverages, Alcohol, and Tobacco (VT 314 million), and Machinery & Electrical Appliances (VT 199 million). Major imports from China were Base Metals and articles (VT 144 million), and Machinery and Electrical Appliances (VT 132 million). Major imports from Fiji were Prepared Foodstuffs, Beverages, Alcohol, and Tobacco (VT 247 million); and Chemical allied products (VT 129 million). Major imports from New Zealand were Machinery & Electrical Appliances (VT 112 million), and Wood, cork & articles thereof & plaiting material (VT 71 million).
3. Trade Balance of Pacific Islands (excluding Melanesian Islands, Australia and New Zealand)
Total Trade Balance of Pacific Islands excluding Melanesia, Australia and New Zealand is VT 4 million. This was driven by exports of Pharmaceuticals to Kiribati (VT 2 million), kava powder less than a million and electronic machines to Wallis and Futuna and imports of perfumes from French Polynesia (VT 1 million), and electrical appliances from Federated States of Micronesia less than a million vatu.
4. Trade by Trade Agreement- Melanesian Spearhead Group
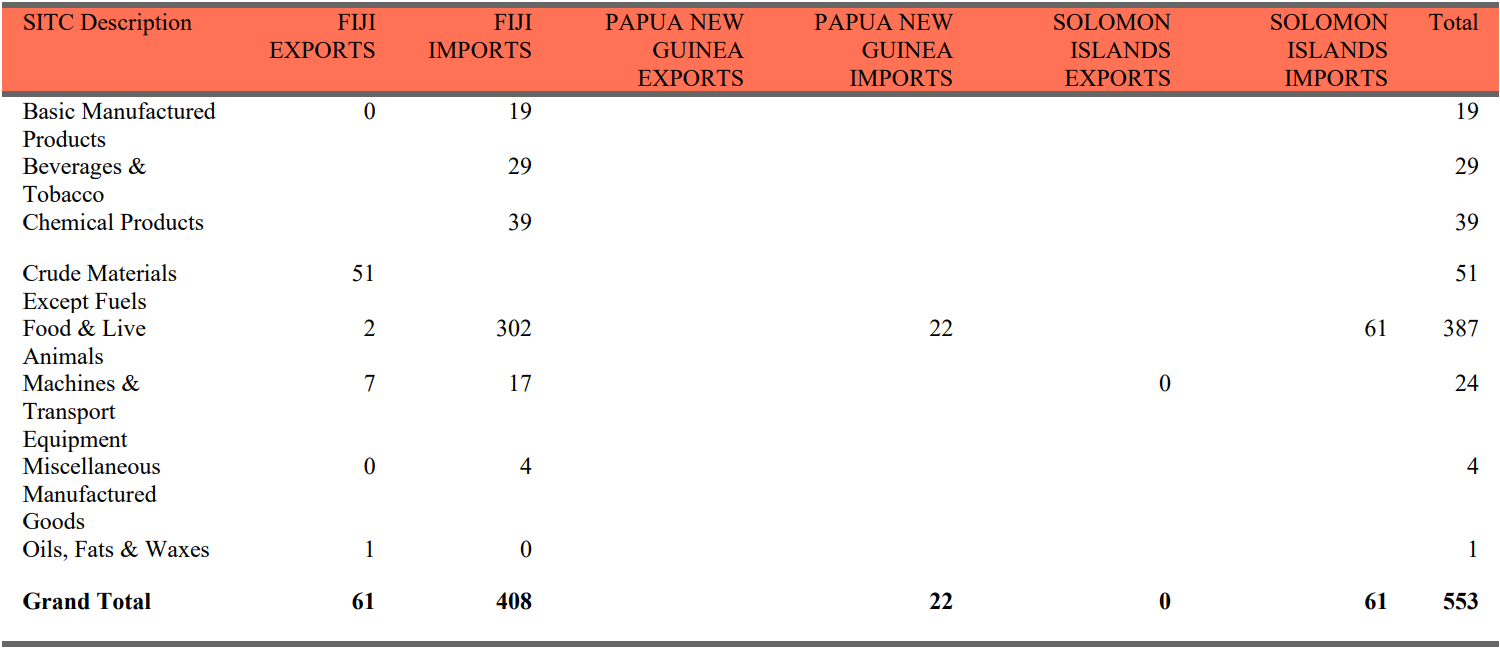
The major imports from Fiji are Bread, Cakes, Pastry and Biscuits (VT 86 million) and Prepared or Preserved Meat (VT 60 million), The major imports from Papua New Guinea is Prepared or Preserved Fish (VT 18 million), and from the Solomon Islands is also Prepared or Preserved Fish (VT 61 million). The major export to Fiji is Kava VT 51 million, and Household effects less a million to Solomon Islands.
5. Principle Exports
The level of production of the top five Major Principal Exports is VT 539 million. The Principal Exports identified included, Cocoa VT 98 million, Coconut Oil VT 9 million, Copra VT 106 million and Kava VT 326 million.
The major country of destination for Cocoa is Malaysia (VT 89 million) and Coconut Oil (VT 9 million). The major country of destination for Copra is Philippines (VT 106 million). Kava is exported mainly to China (VT 113 million), New Caledonia (VT 98 million) and Fiji (VT 51 million).
6. Top 5 New Major Exports
Total value of Personal effects VT 21 million, Scrap metal VT 10 million, Kava Powder VT 8 million, Faulty Dell Server VT 7 million, and Grinder VT 4 million.
7. Principle Imports
Total value of top five Principal imports is VT 2,277 million. The Principal Imports included Alcoholic Drinks (VT 214 million), Articles of Iron and Steel (VT 131 million), Medicaments (VT 136 million), Petroleum Oils (VT 1,614 million), and Rice (VT 182 million). (Refer to Table 7).
The main country of origin for Alcoholic Drinks is Australia (VT 110 million). The main country of origin for Articles of Iron and Steel is China (VT 82 million), and Medicaments is Fiji (VT 68 million). The main country of origin for Petroleum Oils is Singapore (VT 1,594 million), and Rice is China (VT 86 million).
8. Top 5 New Major Imports
Total value of Transport Vehicles VT 65 million, Personal Effects VT 21 million, Ultra Water Meter VT 20 million, Batteries VT 20 million, and Paint VT 14 million.
9. Imports of Dietary Risk Factors for Noncommunicable Diseases
Total value of Bakery Products is VT 143 million and are mainly imported from Fiji (VT 87 million). Total value of Canned Meats is VT 65 million and are mainly imported from Fiji (VT 57 million). Total value of Confectionary is VT 41 million and are mainly imported from Australia (VT 17 million). Total value of Cordial is VT 35 million and are mainly imported from Australia (VT 18 million). Total value of Noodles is VT 4 million and are mainly imported from Australia (VT 2 million). The total value of processed meat is VT 89 million and are mainly imported from Australia (VT 62 million). (Refer to Table 15)
10. Imports of food and products targeted as those that can be produced domestically
Total value of Chicken is VT 170 million and are mainly imported from Australia (VT 130 million). Total value of Canned Tunas is VT 92 million and are mainly imported from Solomon Islands (VT 61 million). Total value of Canned Mackerel is VT 20 million and are mainly imported from China (VT 14 million). Total value of Chicken Eggs VT 23 million and are mainly imported from Fiji (VT 23 million). (Refer to Table 17).
Table Downloads
Table 1_BALANCE OF TRADE - ALL ITEMS
Table 8_BALANCE OF TRADE BY MAJOR PARTNER COUNTRIES
Table 10_ TRADE BY MODE OF TRANSPORT
Table 11_TRADE BY TRADE AGREEMENTS
Table 14_Retained Imports Classified by Broad Economic Categories (BEC)
Table 15_IMPORTS OF DIETARY RISK FACTORS FOR NONCOMMUNICABLE DISEASES
Table 16_IMPORTS TARGETD BY DEPARTMENT OF AGRICULTURE AND RURAL DEVELOPMENT
Table 17_IMPORTS THAT CAN POTENTIALLY BE PRODUCED DOMESTICALLY
The format content in these monthly provisional highlights is as below:
- National Sustainability Development Plan (NSDP Indicators: The NSDP serves as the Country’s highest level policy framework. The indicators provide a system to monitor progress. To report on trade related NSDP indicators, some adaptions has been made. This include ENV E.3.1 report value, not volume ECO 1.5.2 and ECO 1/6/2 reporting on Melanesian Spearhead Group (MSG) agreement, ECO 1.7.1 reporting on level of export production of major commodities.
- Trade Balance of Major Partner Countries: Balance of Trade is the value of a country’s exports and the value of a country’s imports for a given period. The Major Partner Countries are: Australia, China, Fiji, France, Hongkong, India, Indonesia, Japan, South Korea, Malaysia, Netherlands, New Caledonia, New Zealand, Papua New Guinea, Philippines, Singapore, Solomon Islands, Thailand, United Kingdom and United States of America.
- Trade Balance of Pacific Islands, excluding Melanesian Islands, Australia and New Zealand: The Pacific Islands included are: American Samoa, Tonga, Cook Islands, Kiribati, Federated States of Micronesia, Micronesia, Marshall Islands, Nauru, Niue, Palau, Samoa, French Polynesia, Tuvalu and Wallis and Futuna.
- Trade by Trade Agreement - Melanesian Spearhead Group: The Melanesian Free Trade Agreement (MFTA) aims to achieve regional integration of economics in the MSG. It comprises four (4) Countries namely, Fiji, Papua New Guinea, Solomon Islands and Vanuatu.
- Major Principal Exports: Major Exports are commodities that account for the majority of the total export value. The commodity group focus is Beef, Cocoa, Coconut Oil, Copra and Kava. Focus is a time series analysis of current monthly exports from 2018 to 2023.
- Top 5 New Major Exports: The traditional VNSO tables report on 13 major commodities. The rest of the commodities are grouped as “other products”. This investigates the main commodities within “other products”.
- Major Principal Imports: Major imports are commodities that account for the majority of the total import value. The commodity group focus is Alcoholic drinks, Articles of Iron and Steel, Medicaments, Petroleum oils and /Rice. Focus is a timeseries analysis of current monthly imports from 2018-2023.
- Top 5 New Major Imports: The Traditional VNSO tables report on 47 major import commodities. The rest of the commodities are grouped as “other Imports”. This investigates the main commodities within “other imports”.
- Imports of Dietary Risk Factors for Non-Communicable Diseases (NCD): The Pacific has a growing reputation as having one of the world’s highest NCD rates. These major NCD, is share for behavioural risk factors; tobacco use, unhealthy diet, physical inactivity and harmful use of alcohol. This investigates some of the dietary risk factors including Bakery Products, Canned Meats, Confectionary, Cordial and Noodles.
- Imports of Food and Products Targeted as those that can be Potentially Produced Domestically: Import substitution is the idea that; blocking imports of manufactured goods can help an economy by increasing the demand for domestically produced goods. The imports of foods and products targeted include: Canned Mackerel, Canned Tunas, Chicken and Chicken eggs.